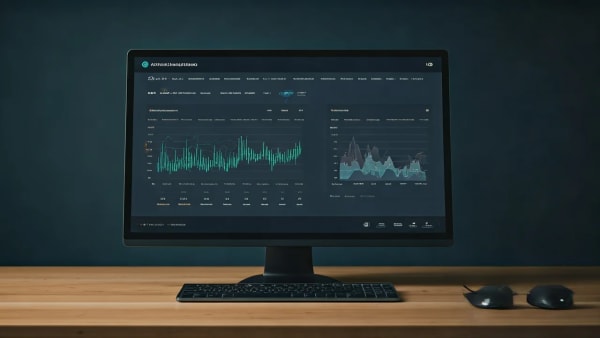
To design a high-performance CFO dashboard in Morocco, you must track three main families of financial KPIs: profitability (gross margin, EBITDA), cash flow (DSO, DPO, WCR, operating cash flow), and operational performance. Integrating these indicators into a Business Intelligence tool like Power BI automates data collection, shifting the financial department from reactive reporting to proactive management.
In offices along Casablanca's Boulevard d'Anfa or in the Tangier Free Zone, the end-of-month ritual often remains the same for financial directors. Teams painstakingly consolidate dozens of Excel files from various departments, while general management awaits precise figures to guide the quarter's strategy. This manual process consumes valuable time and exposes the company to data entry errors that can distort strategic decisions. In the face of economic instability and the responsiveness demanded by the Moroccan market, relying on obsolete or fragmented financial data represents a major risk to competitiveness.
From Reactive Reporting to Proactive Management
The digital transition of financial departments in Morocco is not just about automating accounting entries. It requires a genuine cultural transformation that shifts the CFO from the role of a simple compiler of historical data to that of a strategic partner to general management. Traditional reporting, often delivered several weeks late, only allows for the observation of past variances without the ability to act on the present.
To reverse this trend, it is essential to implement a business intelligence system capable of unifying data sources. Whether it is the company's ERP, invoicing software, or payroll management tools, centralizing flows allows for the generation of real-time indicators. A modern financial dashboard offers this immediate visibility, transforming the constraint of the monthly close into an opportunity for proactive daily management.
Essential Profitability KPIs
Monitoring financial performance relies on a rigorous selection of profitability indicators tailored to the specificities of the Moroccan economic landscape. The primary key indicator remains the gross margin by product line or customer segment. In a context of fluctuating raw material and international transport costs, monitoring changes in this margin allows for rapid adjustments to pricing policies.
Operating income and EBITDA also serve as indispensable compasses for evaluating the intrinsic performance of the business, independent of financing choices or tax rules. For companies operating in distribution or real estate development, like major structures such as Chaabane Immobilier, the return on capital employed and the return on investment of development projects must be integrated into the core of the financial dashboard to guarantee the sustainability of the business model.
Cash and Treasury KPIs
In Morocco, managing payment terms represents a permanent challenge for the financial health of organizations. Cash management cannot, therefore, be limited to simply checking the bank balance at the end of the day. It must rely on dynamic indicators capable of modeling the operating cycle.
Days Sales Outstanding (DSO), which measures the average time to collect customer receivables, is a critical CFO financial KPI. A deterioration of this indicator by just a few days can suffocate the cash flow of a growing company. It should be paired with Days Payable Outstanding (DPO) to assess bargaining power with suppliers, as well as operating working capital requirements (WCR). Rigorous monitoring of net operating cash flow makes it possible to anticipate short-term financing needs and negotiate credit lines with Moroccan banking partners under the best possible conditions.
Building an Actionable CFO Dashboard
The success of a financial Business Intelligence project relies on the clarity and ergonomics of the visual presentation. Using a modern solution like Power BI for CFOs allows for the design of interactive interfaces where essential information is accessible at a glance. A good dashboard must respect a strict visual hierarchy, presenting the company's macroeconomic indicators first before allowing detailed exploration by region, subsidiary, or product manager.
To design a tool that is genuinely adopted by teams, it is recommended to structure the dashboard around three levels of reading. The strategic level offers an overview for the executive committee. The tactical level allows for the analysis of variances against the forecast budget. Finally, the operational level gives management controllers the ability to zoom in on a specific transaction or invoice. This approach ensures perfect consistency of financial information at all levels of the organization.
Common Pitfalls of Financial Dashboards
The main trap when designing a dashboard is the temptation to be exhaustive. Wanting to display too many indicators on a single screen harms readability and dilutes decision-makers' attention. An overloaded dashboard quickly turns back into a giant Excel spreadsheet that no one consults effectively.
Another common mistake is neglecting the quality and freshness of the source data. If data connectors are not automated, teams will still spend many hours manually cleaning files, thereby canceling out the benefits of the Business Intelligence tool. Finally, the lack of contextualization for figures is a major obstacle. A CFO financial KPI is only valuable if it is compared to a historical target, a forecast budget, or industry averages in Morocco. The experts at Data Scale Business support financial departments in defining, integrating, and visualizing these strategic indicators to transform accounting data into a genuine growth driver.